

Theory is one thing, practice another. From years of running digital experiments on marketing programmes and digital experiences, we at Indiginus have learned which tradeoffs to make, when to take shortcuts, and when not to take them.
Here is the Top 10 from our bag of tricks and learnings.
Note: if you are new to digital experimentation, suggest reading my introductory article on the topic first : Strategy by Powerpoint is Dead.
(1) Potential pitfalls in aiming for statistical significance in A/B tests
Statistical significance of 95% – the gold standard for results of A/B tests – can be attained by either:
- Driving a large improvement in the desired performance metric, such as conversion-to-sale %, between version A and B using a small sample size of users, or
- Attaining a small improvement in performance with a larger sample
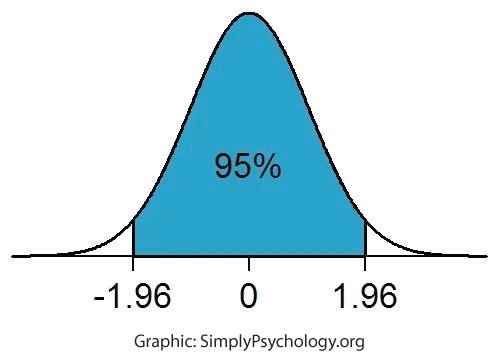
This makes intuitive sense. If version A of a landing page is delivering a huge increase in conversion than version B, chances are that increasing the sample size will not change the result in favour of B. However, if the improvement is small, one needs a higher sample size to prove that the result will endure.
Statistical significance calculators are available on the Internet and A/B testing tools also have in-built calculators. These allow you to calculate the improvement % or sample size required to attain statistical significance.
Be aware of some pitfalls in going strictly by the 95% level of confidence in guiding your decisions:
- If the % improvement of version A vs B is small, even if the result is statistically significant, the costs to implement the improvement may exceed the benefit
- It may make sense to implement a winning version with a <95% confidence level, if the time invested to reach 95% comes at too high a cost on a time-critical project
- If there is other data or research that supports going with a version, waiting for the 95% level to be reached may not be worthwhile. In that case, using the A/B test as one important data point in your decision makes sense.
(2) To drive a big improvement, you may need to sacrifice cause-and-effect
Ideally versions A and B in an A/B test should vary in only a single variable such as a targeting parameter, or a headline, or an image.
However, as single variable changes often result in small improvements, you may have to wait a long time to reach the required sample size for statistical significance. Instead, you can combine multiple changes judiciously to drive a larger improvement over a smaller sample size and therefore time span.
By ‘judiciously’ I mean the changes should be part of the same theme – say multiple changes that together express a different value proposition, or multiple UI changes that make data entry easier. Although you won’t know which specific change drove the improvement, you will at least know the category of changes that did.
(3) Don’t end an A/B test too early, even if significance is achieved
At times one gets excited to see 95% significance reached far quicker than anticipated.
Tempting as it is to end the test and declare victory, if you wait a week or two longer, you might see the graph reverse course and even swing in favour of the other version. As a rule of thumb, we recommend running tests for at least 2 complete weeks, to account for differing behaviours on weekdays and weekends, and to get a sufficiently varied sample.
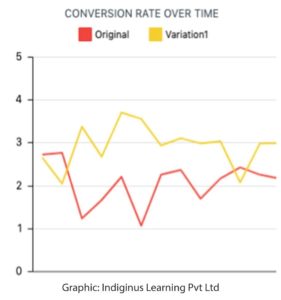
If it feels too quick to be true, better to wait it out.
(4) Look out for problems with sampling sources
While working with a client to A/B test improvements to a user-journey experience, the client’s tech team was having trouble making the new UI design work with the Safari browser. As this was a small percentage of the overall user base, they suggested excluding them from the test.
The problem with this seemingly reasonable suggestion? There may be reasons specific to Safari users – who are largely on the Mac and iOS – that lead them to convert at higher or lower rates. For instance, Mac and iOS users may respond better than the average population to an aesthetically pleasing design.
Even a small user base, if it converts at a high rate, can make the difference between success and failure in an experiment.
Another example of ensuring sampling integrity is to exclude traffic from IP addresses within the company, as these users do not represent your customers, and may include internal teams reviewing the A/B test post-launch.
(5) How can startups with low traffic run A/B tests?
There are three potential solutions:
- Spend marketing money to drive traffic to the test and attain a large enough sample size. In order to reduce the traffic required, you may need to combine multiple changes into a single test (see point 2 above).
- Use proxies for conversion. While your conversion on A/B versions of a landing page may be in very low numbers, you can look at the time spent on each page as a proxy for how useful it is for the user.
- Make it a partly qualitative test. Once you have some data, even though you have not reached statistical significance, reach out to customers individually and understand why they went down their journey (or why they did not).
You will likely need to show them the experience again to jog their memory. You can also show them the alternative they did not pick, and get their feedback. Not perfect by any means, but much much better than not doing it at all.
(6) Use experiments to gauge the nature of demand
A young company we are advising is planning an entirely new business vertical for their existing customers. They were focusing on lining up suppliers for specific categories, and then launch the service on the front-end.
We recommended the opposite – to go ahead and ‘launch’ the service without having supply in place. Based on the categories chosen by the most users, they could then prioritise categories and suppliers for launch.
In this scenario, unaware that they are part of a test, users will encounter a ‘coming soon’ page at the end of their journey. This is a great opportunity to gather targeted sign-ups for the future launch.
(7) It’s not only about page A versus page B
A/B testing tools include several other features that are immensely helpful.
You can run an A/B test on an entire funnel across a series of pages, to see which journey, and not just a single page, converts more effectively.

Heat maps tell you which parts of the page are drawing user attention, which can help you make quick design decisions, including the design of your A/B test.
For a client, the heat map told us that users were spending disproportionate time on the date-of-birth field, both because it was cumbersome to fill out, and – as we found out through qualitative feedback – people were debating whether to enter their true date of birth.
We moved that field off the first page of registration, and worked on both UI improvements and communication to encourage people to enter their correct birth date, leading to improvements in conversion.
Form analytics tell you which field in a form is resulting in drop-offs, by recording the last field that each user reached. In the above example, the date-of-birth field was also the highest drop-off field based on form analytics.
Scroll maps tell you the percentage of users who are scrolling down to various sections of your page, nudging you to rearrange the layout. This is particularly important for mobile pages that tend to be longer than desktop versions.
Screen recordings are video recordings of individual user screens and actions including cursor movements, scrolls, typing, etc. Once your analytics data identifies a bottleneck, these recordings are very useful in figuring out why users are getting stuck at that point in the experience.
(8) Not everything has to be an experiment
Fonts that are clearly too small for the mobile screen need to be increased in size. A huge drop-off at an important point in an acquisition funnel needs an immediate fix of obvious problems while the A/B test is constructed in parallel. User-input related data integrity issues often need to be addressed faster than the time taken for an A/B test allows.
Let’s not go overboard with experiments. Fix the obvious problems in parallel.
(9) Hypotheses for testing must be based on sound reasoning
Don’t just run experiments randomly, as each test has costs of effort and potential failure associated with it. Hypotheses should be prioritised in detail based on insights obtained from customer research and data, potential impact on business and cost of implementation.
Often in projects at Indiginus, we leverage the wisdom of the crowd to prioritise a long list of hypotheses. With 5 to 8 highly involved team members voting, collective intelligence is often a good enough – and faster – proxy for more detailed cost-benefit analysis.
(10) Make experimentation a part of how you work
Don’t just stop at the stage of a special project that kicks off A/B testing in your organisation. Incorporate experimentation as an integral part of your marketing and product development.
Sometimes we hear from companies that they can’t afford the time to experiment, which is another way of saying “We want to focus on building things rather than building things that measurably succeed”. Surely that can’t be a time saver on the path to reaching your goals.